*This post is written by our Preferred Lender*
Week of July 25, 2022 in Review
The last week of July was jam-packed with news, including a Fed rate hike, hot inflation numbers, crucial housing data and a negative reading for second quarter GDP. Here are the key headlines:
-Fed Hikes Rates Another 75 Basis Points
-Consumer Inflation Reaches 40-Year High in June
-Signed Contracts on Existing and New Homes Slowed in June
-Home Price Appreciation Still Hot in May
-Does the Negative Second Quarter GDP Reading Signal a Recession?
-Initial Jobless Claims Top 250,000 for Second Straight Week
Fed Hikes Rates Another 75 Basis Points
As expected, the Fed hiked its benchmark Fed Funds Rate by an aggressive 75 basis points at its meeting last Wednesday. This follows the 75 basis point hike they made at their June meeting, and marks only the second time the Fed has hiked by 75 basis points since 1994.Note that the Fed Funds Rate is the interest rate for overnight borrowing for banks and it is not the same as mortgage rates. The main tool the Fed uses to curb inflation is hiking its benchmark Fed Funds Rate, so counterintuitively Fed rate hikes can be good for mortgage rates if they’re perceived to curb inflation.
What’s the bottom line? During his press conference, Fed Chair Jerome Powell said that another “unusually large increase could be appropriate” at their meeting on September 20-21, but it will depend on the data received between now and then. This includes the July and August Jobs Reports, as well as key inflation numbers. Unusually large means they are leaving another 75 basis point hike on the table for September, but they may have to moderate the amount based on data we receive.
Consumer Inflation Reaches 40-Year High in June
The Fed was certainly watching on Friday when its favorite measure of inflation, Personal Consumption Expenditures (PCE), showed that inflation rose a hotter than expected 1% in June. The year over year reading rose from 6.3% to 6.8%, which was higher than the 6.7% expected and the highest reading since 1982. Core PCE, which strips out volatile food and energy prices, rose by 0.6%, pushing the year over year change from 4.7% to 4.8%.
Signed Contracts on Existing and New Homes Slowed in June
Pending Home Sales fell 8.6% from May to June, coming in much weaker than the 1% decline expected. Sales were also 20% lower than they were in June of last year. This is a critical report for taking the pulse of the housing market, as it measures signed contracts on existing homes, which represent around 90% of the market.

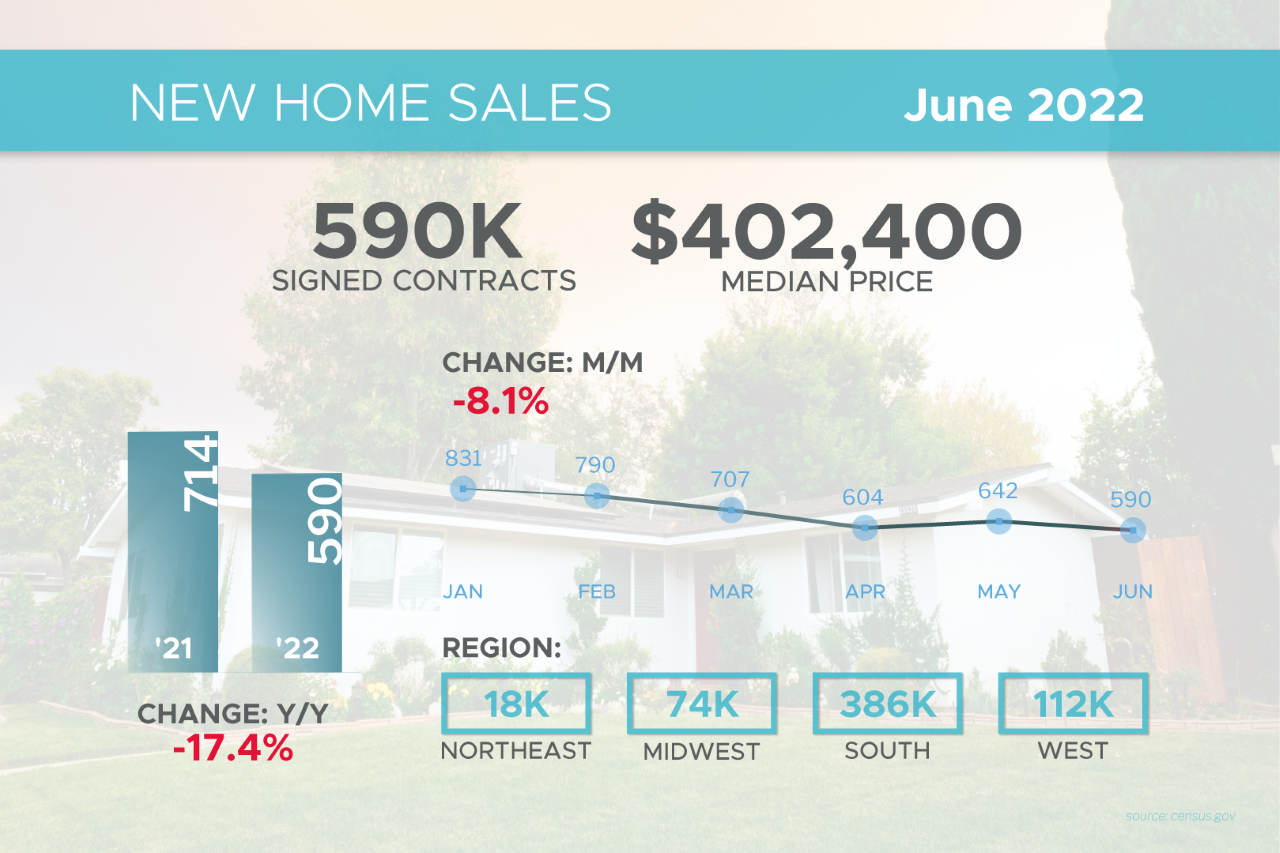
New Home Sales, which measure signed contracts on new homes, also declined 8.1% in June to a 590,000-unit annualized pace. In addition, May’s report was revised sharply lower from 696,000 to 642,000 signed contracts. Year over year, sales were down 17.4% in June.
Also of note, the median price for new homes moved lower from $444,500 in May to $402,400 in June. But remember, this is not the same as appreciation. It simply means half the homes sold were above that price and half were below it and it could reflect people shopping for lower priced homes or even choosing lesser amenities when signing contracts in June. Two crucial appreciation reports showed that appreciation remained at very strong levels in May. See those details below.
What’s the bottom line? There is no doubt that higher interest rates have impacted demand for homes, especially in June when rates had reached their apex. But low inventory continues to be a factor as well. Remember, a 6 months’ supply of homes is considered representative of a balanced market. There were 1.26 million existing homes available for sale at the end of June, which equates to just a 3 months’ supply, and 457,000 new homes, representing a 9.3 months’ supply.
However, that’s not the whole story when it comes to new home inventory.
Only 41,000 or about 9% were actually completed. The rest were either not started or under construction, which speaks to the delays and supply chain constraints builders have faced. When factoring in the amount of completed homes, the month’s supply of homes available was really less than a month at 25 days. This ongoing imbalance of supply and demand should continue to be supportive of home prices
Home Price Appreciation Still Hot in May

The Case-Shiller Home Price Index, which is considered the “gold standard” for appreciation, showed home prices rose 1.5% in May and 19.7% year over year. This annual reading is a slight decline from the 20.6% gain reported in April but still extremely hot.
The Federal Housing Finance Agency (FHFA) also released their House Price Index. This report measures home price appreciation on single-family homes with conforming loan amounts, which means it most likely represents lower-priced homes. Home prices rose 1.4% in May and 18.3% year over year. This is a slight decrease from the 18.8% rise reported for April, but again still very hot.
What’s the bottom line? The Case-Shiller and FHFA reports are dated as they’re for May, but appreciation was still extremely strong as of that time. While these reports do not fully take into account the rise in interest rates we’ve seen this year, they do include some of the increase. With appreciation still so strong through May, this is supportive of the belief that while we may see home price gains slow, we shouldn’t see decreases in pricing.
Does the Negative Second Quarter GDP Reading Signal a Recession?
The first or advanced reading of second quarter GDP came in at -0.9%, which follows the -1.6% final reading that was reported for the first quarter. While it’s possible that the reading for the second quarter may be revised when the second and final readings are reported on August 25 and September 29 respectively, as of now we do have two consecutive quarters of negative GDP.
What’s the bottom line? While two consecutive quarters of negative GDP is not the official definition of recession, it became a Wall Street rule-of-thumb because we have never had successive quarterly declines in real GDP without the National Bureau of Economic Research (NBER) officially announcing one. The NBER will ultimately make the call regarding whether we’re in a recession and they may wait to see some increases in the unemployment rate before doing so. Recession or not, growth has slowed notably this year and is continuing to do so in the third quarter as well.
Initial Jobless Claims Top 250,000 for Second Straight Week

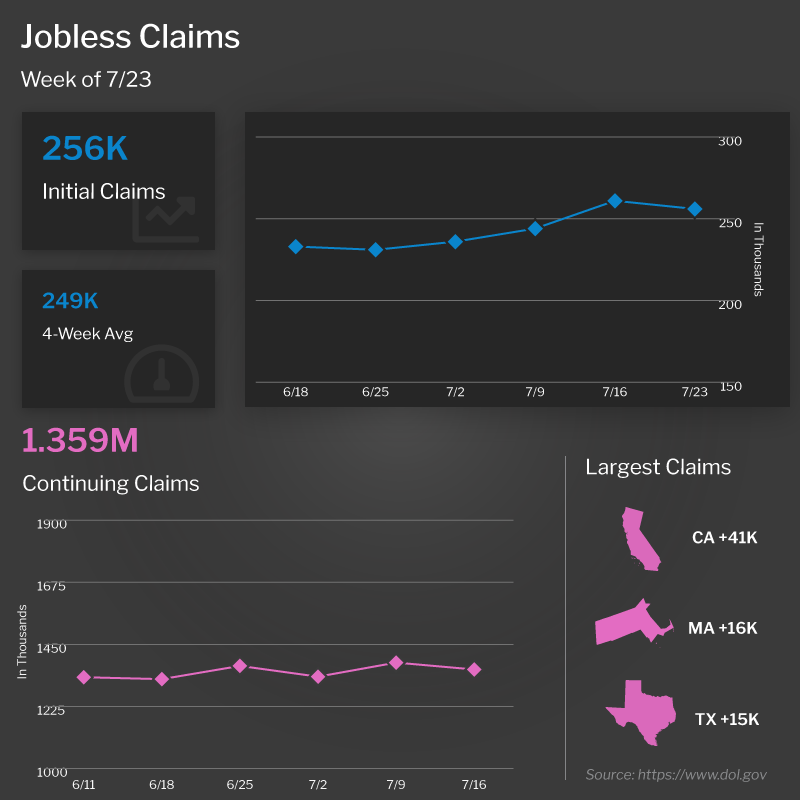
Initial Jobless Claims fell by 5,000 in the latest week, as 256,000 people filed for unemployment benefits for the first time. However, the previous week’s tally of Initial Jobless Claims was revised higher by 10,000 to 261,000. The last two weeks of reporting mark the only times Initial Jobless Claims have topped 250,000 since last November. Continuing Claims, which measure people who continue to receive benefits after their initial claim is filed, fell by 25,000 to 1.359 million.
What’s the bottom line? Initial Jobless Claims have been steadily moving higher, with the 4-week average increasing again to its highest level since November. The trajectory higher is likely to continue, given the announcements of significant layoffs from several public companies, which means we will eventually see a higher unemployment rate. This report can be the “canary in the coal mine” to show that the job market is starting to soften.
What to Look for This Week
The first full week of August means crucial news from the labor sector is ahead. On Thursday, the latest Jobless Claims data will be reported while Friday brings the Bureau of Labor Statistics Jobs Report for July, which includes Non-farm Payrolls and the Unemployment Rate.
Note that ADP announced they are retooling their Employment Report, which measures private sector payrolls, so that report will not be released this week.
Also of note, the ISM Index for July will be released on Monday and may give us more clues if there is further slowdown in the manufacturing sector.
Technical Picture
Mortgage Bonds broke above overhead resistance at the 100-day Moving Average on Friday. If this result holds, the next ceiling is up at the 102.214 Fibonacci Level. The 10-year is currently trading in the middle of a range with the 2.577% Fibonacci level acting as support and a dual ceiling comprised of the 100-day Moving Average and 2.79% level.
Shelley Ann Covington | NMLS ID# 102076
Branch Manager/Mortgage Consultant
Penrith home Loans LLC
11411 NE 124th Street, Suite 110 | Kirkland, WA 98034
Fax 425.823.8425 | Cell 206.255.5814
shelley.covington@penrithloans.com| https://www.penrithloans.com/consultants/shelley-covington
“The greatest compliment a client can give me is to share my name with friends and family”
Apply online for a free preapproval!
Our Certified Buyer Program is designed to get you home.
